

Here at Nickelled, we spend a LOT of time talking to customers and potential customers about onboarding.
A question we always ask up front is 'how will you measure success?'.
And the number of SaaS companies who can't answer this simple question would blow you away.
If you're thinking about a strategy to welcome, activate and retain your users, you NEED to know what you'll measure to make sure it's a success. Otherwise, you may as well do nothing.
Fortunately, we have a bunch of prepared SaaS onboarding metrics which we've seen used with great success inside SaaS companies – here are the ones you'll need to know about.
Types of metric
Broadly, we recommend thinking of the metrics you're going to use to measure you onboarding in three distinct buckets.
- User metrics – used to examine behavior on the user 'headcount' level, without paying much attention to their activity
- Session metrics – used to examine what users are doing in each session they have with your product
- Process metrics – used to examine what users are doing in each session
Hopefully, your technology stack is set up in such as way that you can pull metrics like this out relatively easily. If not, we recommend reading our blog post on configuring an analytics stack here, or downloading our full book on user onboarding here (both go into a bit of technical detail).
User metrics
To make sense of your onboarding process, you'll need to have some idea of what your inputs are – i.e. how many people are entering the onboarding funnel and how many are exiting.
Users Currently Onboarding
At Nickelled, we measure the above as a simple aggregate number of people who have signed up for our software in the last 14 days and are therefore still considered to be getting to grips with the software. It's a shared definition across the business (i.e. our sales and customer success teams both work from the same group) and it feeds into all of our dashboard.
Active Users
Being able to cut metrics by the number of active users is useful, so we recommend tracking these numbers too.
You may wish to measure by Monthly Active Users – the number of users who have been active in a given month – or Daily Active Users, the number of users who are active on a given day.
Either way, you should be able to use MAU/DAU counts to figure out what percentage of your users currently in the onboarding process are behaving in the way you'd expect.
Session Metrics
After you know exactly how many users have signed up and how many are active, you can get a little more granular by examining session metrics.
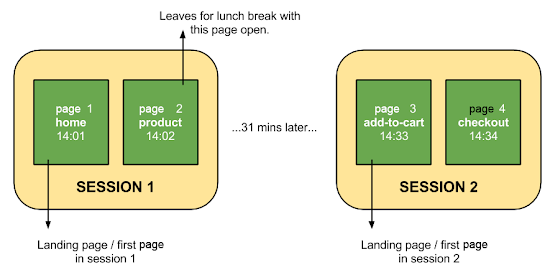
Put most simply, a session can be thought of as a time period that a user spends using your software. If Jane sits down and logs on twice in a day, we'd measure that as one user, two sessions.
Fortunately, Google Analytics makes sessions easy for us by automatically separating sessions out, using either:
- a 30-minute inactivity cutoff point
- the stroke of midnight
After both of these, a new session is started if the user returns. There's some more information on this here and this image sums it up fairly well:
Armed with the number of sessions each user has completed, we can dive even deeper into our SaaS onboarding metrics.
Number of Sessions Per User
This metric is a fantastic way to examine how 'sticky' your product is – how many people come back to use it again after signing up for the first time. A high number of sessions per user suggests that they're finding value from the product.
Abnormal or erratic sessions per user can also provide valuable insight into user behavior – for instance, if a user repeatedly visits the same page or process, it could be a signal that they are struggling to use or experiencing problems there. Keep an eye for outliers so you can take appropriate action to improve the onboarding experience.
Session duration
Not all products require users to spend vast amounts of time in front of them, but session duration is usually a reasonable indicator of value extraction. After all, nobody's going to spend hours in front of an app they're not getting anything out of, right?
Keep an eye on the session duration through the lifetime of users – it's not uncommon for durations to fall as users become more acquianted with the product and need less time to find their way around.
Again, look for outliers – customers who enter your onboarding process but have extremely low session durations may be unaware of your value proposition or 'bad fit' customers who aren't clear on what they signed up for. Both should be avoided.
Retention
Retention is a corollary of sessions per user, as measured over a given time period. It effectively measures whether a user comes back on the same day, week, or month as they joined, and as such, as used fairly widely to measure onboarding.
At the most simple level, if ten users sign up on one week but only eight return the following week, the week one retention is 80%. The same holds true for months, days or whichever timescale you choose to use, and it generally ends up falling off over time, leaving you with a chart that looks something like this:
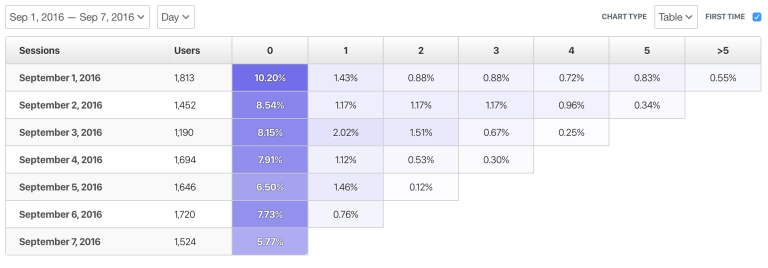
Image courtesy Heap Analytics
Of course, if you're changing your onboarding processes as you go along (continuous improvement #ftw!), you'll need to break up your retention numbers into groups, so that a user who experienced on process isn't measured in the same group as users who experienced another.
To do this, we use cohort analysis, which is a little more involved but incredibly powerful – we wrote a full guide to it here:
Event Metrics
Armed with visitor information and repeat rate information, you can finally dive into WHAT users are doing in the onboarding process. We call these metrics event metrics, and they're entirely reliant on you being able to establish who's doing what in your app accurately. If you can't do that, check out the analytics links we posted earlier.
Onboarding Process Completion Rate
Many companies choose to measure their onboarding process according to activities completed, rather than a simple time-based measurement. Doing things like this is highly recommended, assuming that you're 100% sure of WHAT actions will be the most useful for a new user. If you don't understand this, you could end up forcing users to complete activities that don't provide enough value.
Assuming you do know what your key activation events (more on this here) are, measure your onboarding process completion rate as a percentage of people who complete every event that you've mapped out for them.
If they can be completed in order, you might be able to plot a nice drop-chart using software such as Amplitude, which will probably look something like this:
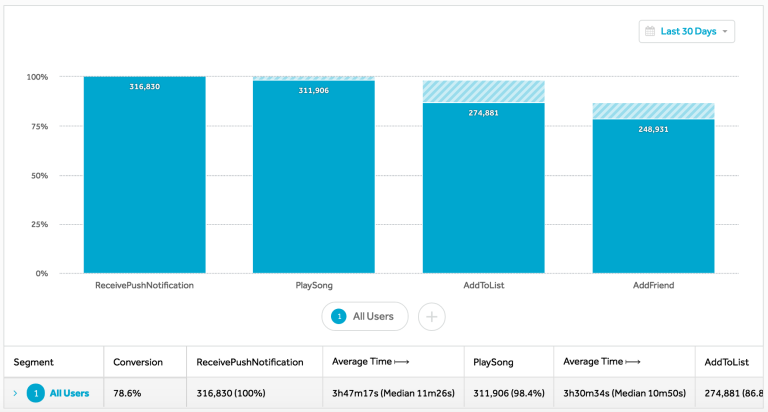
Image courtesy Amplitude
If you have offline events that are part of the onboarding process, include these too. Often, our clients will mandate some form of customer training as part of the onboarding – for the user to have completed the whole process, they'll need to have done everything that you mandate to be important.
Now, for an app like ours, that might include core events that we know are vital for first-time users such as inviting a team, creating a guided tour or setting up company details. If only 3 of every ten users manage to complete all three, our onboarding process completion rate is 30%.
For a larger enterprise-focused company, it could include more offline events such as attending workshops or identifying trainers to be used in a train-the-trainer approach.
Key Activation Event Completion Rate
Although somewhat similar to the metric above, this metric can be measured solely on in-app events. If there are five key activation events, checking what percentage of users are ticking off all of them is an exercise that's well worthwhile.
Time to success/time to value
Time to success is one of my all-time favorite metrics to track, although it requires a high degree of customer insight and can get tricky with complex apps – you won't be able to measure it without knowing exactly what your user is hoping to get out of your SaaS app.
Once you do, you should be able to exactly measure the time between them signing up and finally extracting some value from working with you – it's perhaps the purest measurement of how well you're working for your customers.
Remember that key activation events should be considered the 'stage gates' on this journey, as you'll probably require multiple activation events before the user is able to extract value.
Also, bear in mind that the user's perception of value may be different from yours. For our guided tour app, for instance, it was tempting to assume that a user simply creating a tour would equal value realization. Of course, things aren't that simple – value is actually only realized when our clients put their guides in the hands of their end users, at which point Nickelled can really start saving them money or driving more revenue.
What metrics do you use to measure customer success?
