Cohort Analysis for SaaS Business
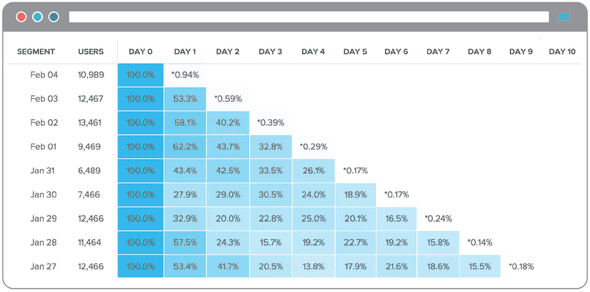
Calculating the activity of groups of users over time is the most common application you’ll see for cohort analysis in the SaaS world, because it’s much, much more accurate than any other way you might do it.
Without splitting user groups down into cohorts, checking retention is a complicated business — essentially you’d need to take a snapshot of all users, and see what their activity is on the site.
This is a flawed model, as any given group of users will include some that signed up last week and proportionately fewer who signed up longer ago.
Given that the composition of your customer base is changing all the time, seeing who’s active based on the entire user group doesn’t make much sense, as activity (for most SaaS business) tends to decrease over time.
This is best illustrated during large marketing pushes, where the total user base may increase significantly, creating a false positive metric.
Getting a more accurate picture
Using cohort analysis it’s possible to split this group of new users out, to examine whether they’re actually valuable or not.
If marketing pushes result in disengaged users joining the platform, they should be discontinued — but you’d have no way of knowing that without comparing the marketing-driven cohort against a more organic cohort.
So you can see that cohort analysis is phenomenally useful in this scenario.
Applied over the long term, the above logic can lead to a dangerous situation for SaaS businesses where the growth in new customers can mask deeper issues with retention.
Image this: you have hundreds of new users joining every week, but none are converting, or they’re converting more slowly than other users.
How long would it take you to realize that you have a significant issue with your business?
Without cohort analysis, that issue may not be apparent until the new (poorly converting) users make up the majority of the user base — by which point it may already be too late.
Use case 2: Building growth
SaaS companies can also use cohorts to get very smart in optimization, allowing them to grow far faster than they would be able to were all results treated in aggregate.
Assuming monthly revenues can be broken down into channel-based cohorts, for instance, the business can easily see which channels are overperforming or underperforming relative to others, and make correctional adjustments throughout the month.
But add another layer of consumer data to the cohorts (such as activity) and it’s possible to pull out even more significant insights
Imagine, for instance, knowing that PPC marketing performs exceptionally well over the summer and very poorly during the winter holidays. Immediately, a smart SaaS business can redirect budgets to the most profitable channels for the time of yeah accordingly.
Even after users have been acquired, breaking them down into activity-based cohorts can be exceedingly valuable in driving revenues.
By isolating certain behaviours, cohort analysis helps SaaS business to understand the effect of product decisions, test hypotheses quickly and shorten the time to success for users.
A segment-based cohorts example
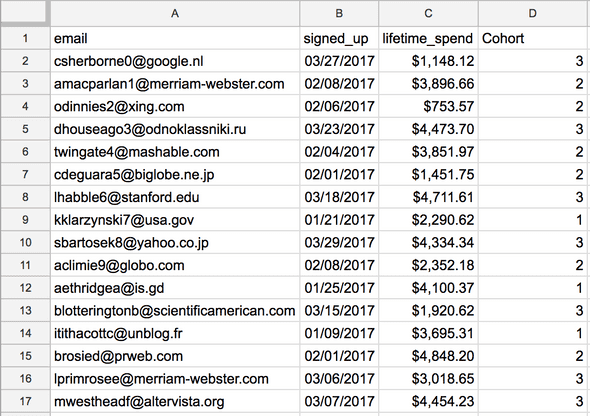
On the first page of this guide, we looked at a simple example where users who added a profile picture spent more money on the business:
Setting up time-based cohorts like this is one way, but delving into segment-based cohorts can be far richer.
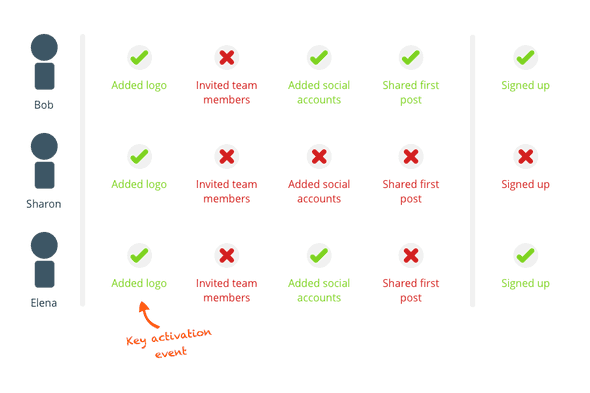
For example, a SaaS business that wants to improve its trial-to-paid conversion rate (a direct revenue generator) could cohort users according to the main events that they completed within the app:
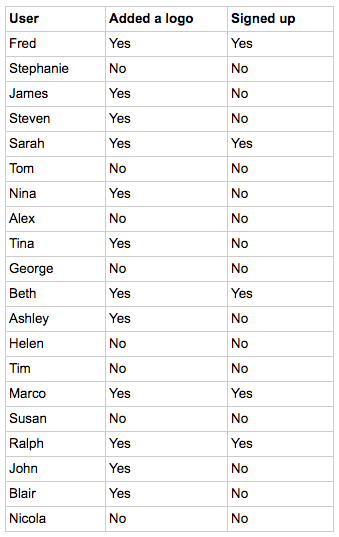
And then plot the number of users who eventually completed a conversion vs those who didn’t against each of the events:
In this example, again, the (very minimal) data appears to suggest that adding a logo has a significant correlation with the conversion activity (as 2/3 converted users completed the step).
This information could be actioned by a customer onboarding specialist to ensure that all trial users uploaded a logo, improving the conversion rate.
Use case 3: Forecasting
We briefly mentioned testing hypotheses above, but advanced SaaS businesses use cohort analysis to compile exceedingly accurate forecasts on future performance.
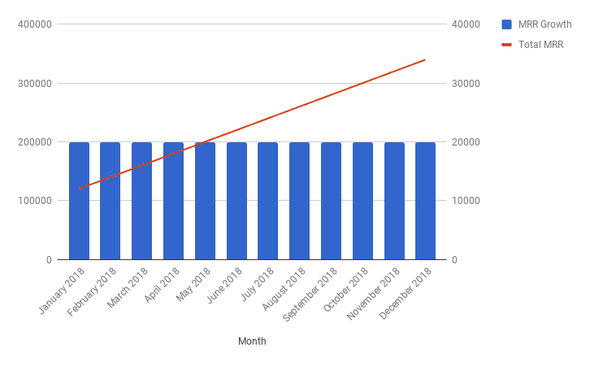
At the most basic level, financial forecasting should be conducted at a package level, which is essentially impossible without cohort analysis – different packages invariably have different levels of churn and different monthly recurring revenue (MRR) averages (need sure about MRR? Check out ProfitWell's superb guide to monthly recurring revenue).
In the following example, revenue is treated in aggregate, with a straight-line growth forecast applied across all users at a uniform MRR.
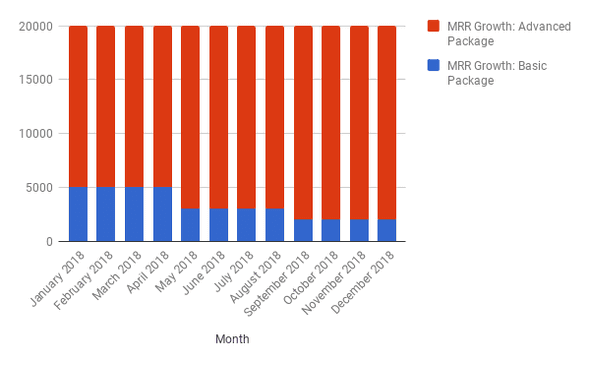
By splitting out the packages, we can see that actually, the majority of future growth comes from one package only:
Going one level deeper on this data would allow a business to forecast based on other variables, such as country or size of customer, to compile an even more accurate forecast.
Finally, let's take a look at the ways SaaS product teams can use cohort analysis – starting with flipping the whole process on its head.
Reversing cohort analysis is particularly useful for product managers because it allows them to work backward from the goal.
For example, if my goal was a trial to paid conversion, reverse cohort analysis would allow me to cohort only the users who have completed that goal according to what they did along the way.
Thanks to tools such as Mixpanel and Amplitude, reverse cohort analysis is now available to all startups (who've got their tracking sorted out) and is also relatively trivial to use (we'll cover both of these tool in more detail in chapter five).
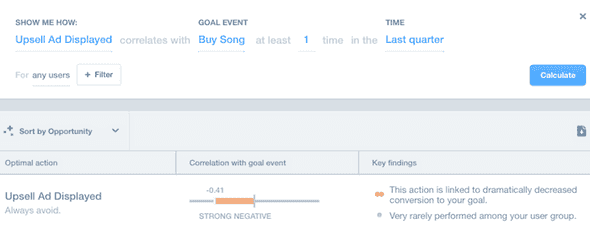
Below, for instance, you can see a Mixpanel screenshot that shows how the software can extract all events that have a high correlation with buying a song:
With Mixpanel retrospectively cohorting users into various behaviors, we can see that in fact, one screen had a strong negative correlation with buying a song:
Assuming that we want to sell more songs, this insight is invaluable – it suggests that this screen may be STOPPING people from purchasing and that by removing the screen altogether, our fictional music app may be able to win more sales.
The product implications of this should be immediately obvious – working backward from a user's "aha moment" becomes trivial, and the steps that any given user takes to reach that point should be clear to all.
Once product changes are made according to the process above, product usage can be measured using traditional cohort analysis. One particular metric product managers will want to keep a close eye on is long-tail retention, which is the long-term usage of a given feature.
For example, let's say that a new feature is added to a product and usage spikes. On the surface, this is a relatively useless metric – it's only natural that users (new and old) rush to a brand-new feature at launch.
However, using long-tail retention and cohort analysis, we can see how many of our users are returning to use the feature week-after-week.
If new and old users are still using a feature seven weeks in, we're in a good place. If usage has dropped off, that new feature might not be the magic bullet you thought it was.
If you've read this far in the guide, you're sold on the ability of cohort analysis to transform your business. Next up, we'll look at how to do it for yourself.
